Restaurant Consumption Management: How to Track Ingredient Usage and Control Food Costs
November 17, 2026
.Blog
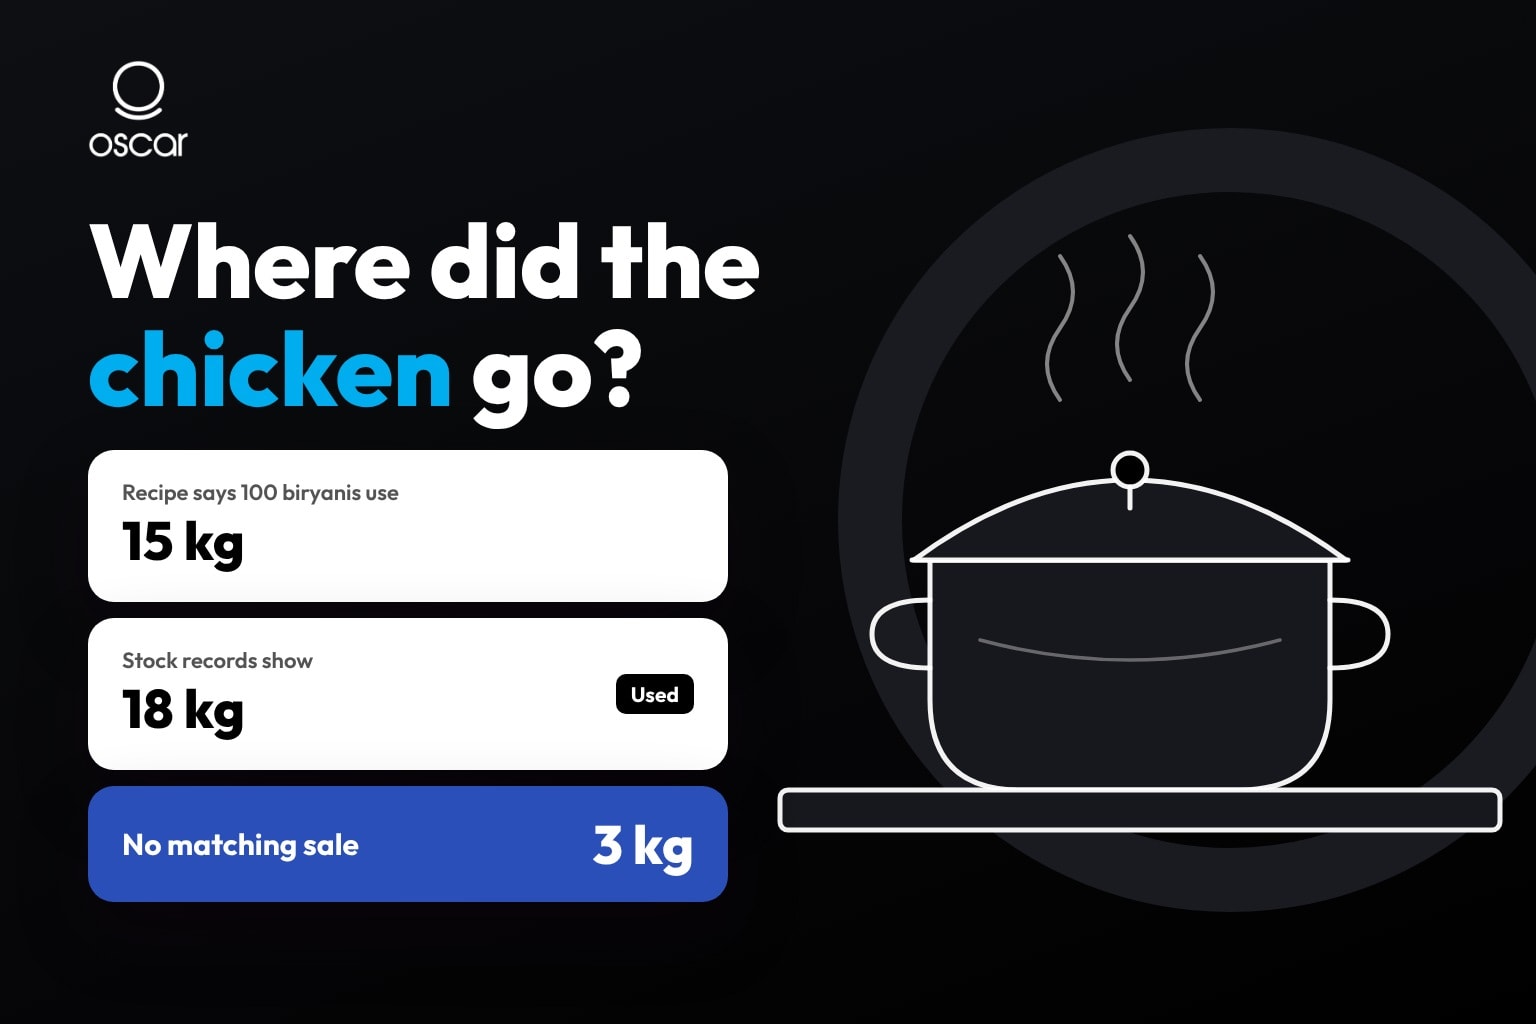
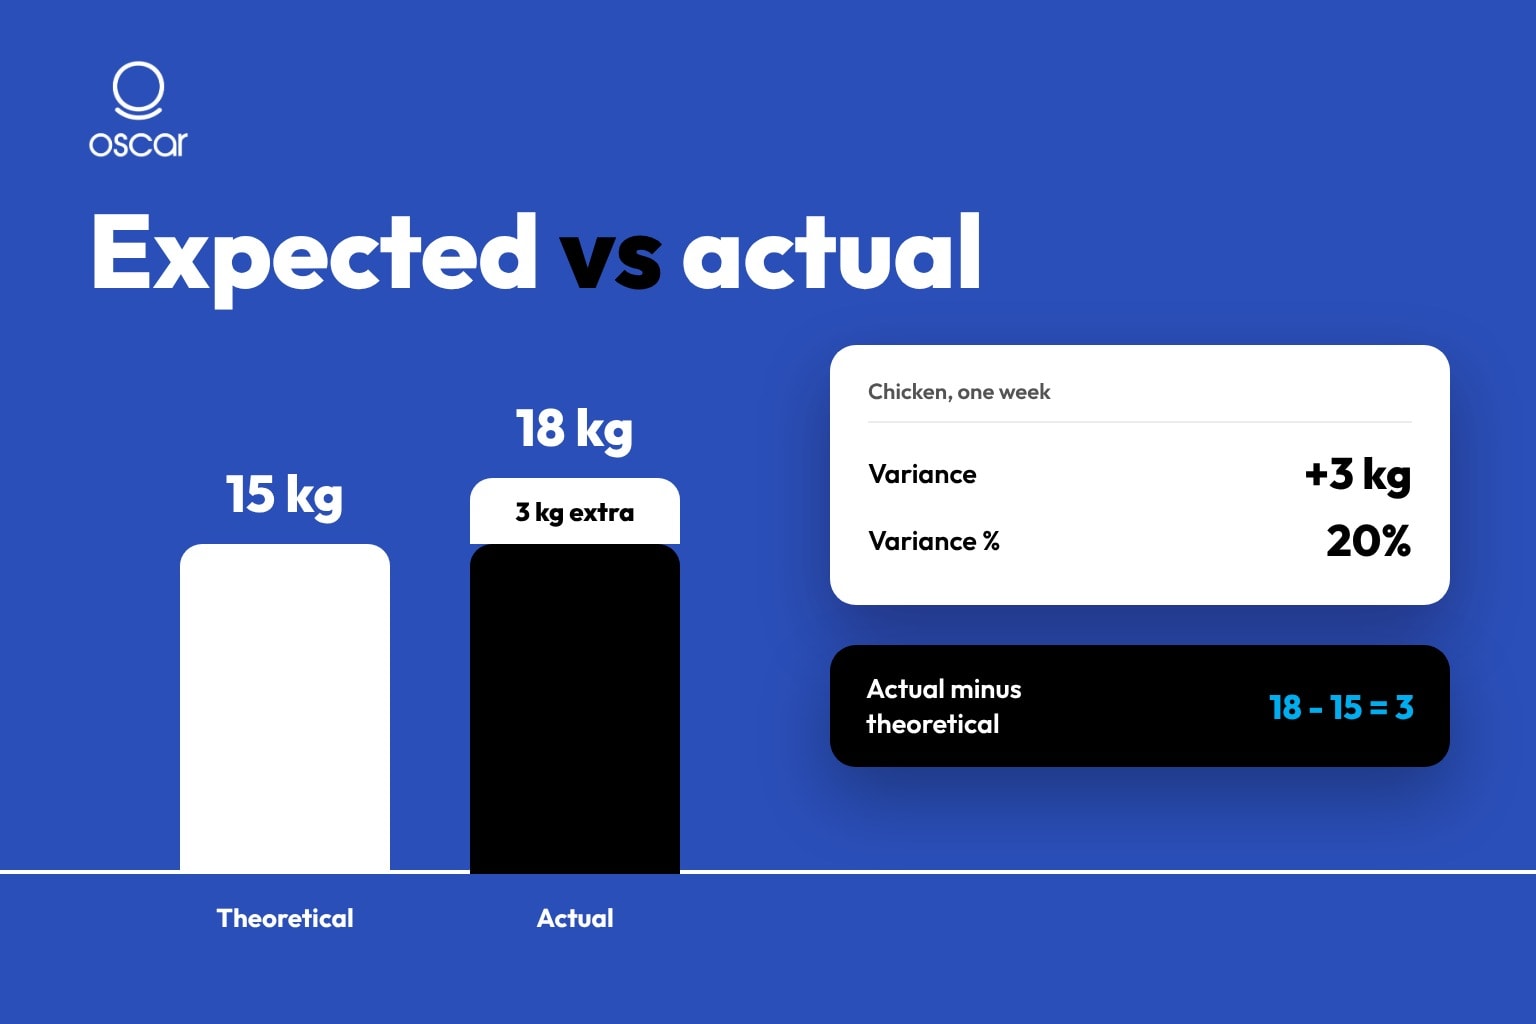
A restaurant sells 100 chicken biryanis. The recipe calls for 150 grams of chicken per plate, so the kitchen should have used 15 kg. The stock records show 18 kg gone. Three kilograms of chicken left the kitchen without a matching sale, and unless someone compares those two numbers, nobody will ask why.
That comparison is restaurant consumption management. It sets the quantity of each ingredient your sales say you should have used, measures what you actually used, and investigates the gap. This guide explains the full process, the formulas, the usual causes of excess usage, the practical fixes, and how restaurant software can run most of the arithmetic for you.
What Is Consumption Management in Restaurants?
Restaurant consumption management is the practice of calculating how much of each ingredient should have been used based on the dishes sold, measuring how much was actually used, and investigating the difference. It links recipes, point-of-sale (POS) sales and stock records into one control process, so owners can find where ingredients and money are being lost.
It is easy to confuse with inventory management, but the two answer different questions:
Inventory data is an input to consumption management, not a substitute for it. A restaurant can hold perfectly accurate stock counts and still have no idea that its kitchen uses 20% more chicken than its menu justifies.
Why Is Restaurant Consumption Management Important?
Because food is a major cost, and a gap between expected and actual usage is money you have already spent. Four benefits follow from measuring it:
- Tighter food cost control. Food cost percentage tells you that costs moved, not which ingredient moved them. Ingredient-level variance shows the source, so you fix a specific problem instead of raising prices or cutting quality across the menu.
- Less waste and fewer unexplained losses. Over-portioning, spoilage and unrecorded discards all show up as usage you cannot explain. Seeing them in numbers makes them manageable.
- More accurate purchasing. When you know what each dish really consumes, orders can follow real demand rather than habit, and recipe costs stay in step with supplier prices.
- Clearer accountability. A weekly variance report gives kitchen and branch managers a shared, factual starting point. It also protects honest teams, because many gaps turn out to be recipe or record errors, not misconduct.
As one restaurant software provider puts it, the gap between actual and theoretical cost is where profit leaks. Consumption management is how you find the leak.
How Does Restaurant Consumption Management Work?
It works as a repeating cycle of eight steps. Each step feeds the next, and the final step feeds back into the first.
- Record purchases and receipts. Log the quantity of each ingredient received, checked against the invoice, so stock records start from what actually arrived.
- Standardize recipes. Give every menu item a recipe with ingredients, quantities, portion size, preparation yield and cost per serving.
- Record sales through the POS. Capture the number of portions sold for each menu item, including modifiers, comps and voids.
- Calculate theoretical consumption. Multiply recipe quantities by portions sold to get the expected usage of each ingredient.
- Measure actual consumption. Use opening stock, purchases, closing stock and adjustments such as transfers, returns and recorded waste.
- Compare actual with theoretical. Calculate the variance for each ingredient, in quantity and in percentage.
- Investigate discrepancies. Check data accuracy first, then operational causes such as portioning, spoilage and receiving.
- Take corrective action. Fix recipes, retrain staff, improve recording, adjust purchasing, then run the cycle again.
The cycle is only as reliable as its weakest step. If recipes are outdated or the POS is not mapped to them, the theoretical figure is wrong and every variance after it is misleading.
How to Track Ingredient Consumption in a Restaurant
Ingredient tracking rests on four building blocks. If any one is missing, the numbers will not reconcile.
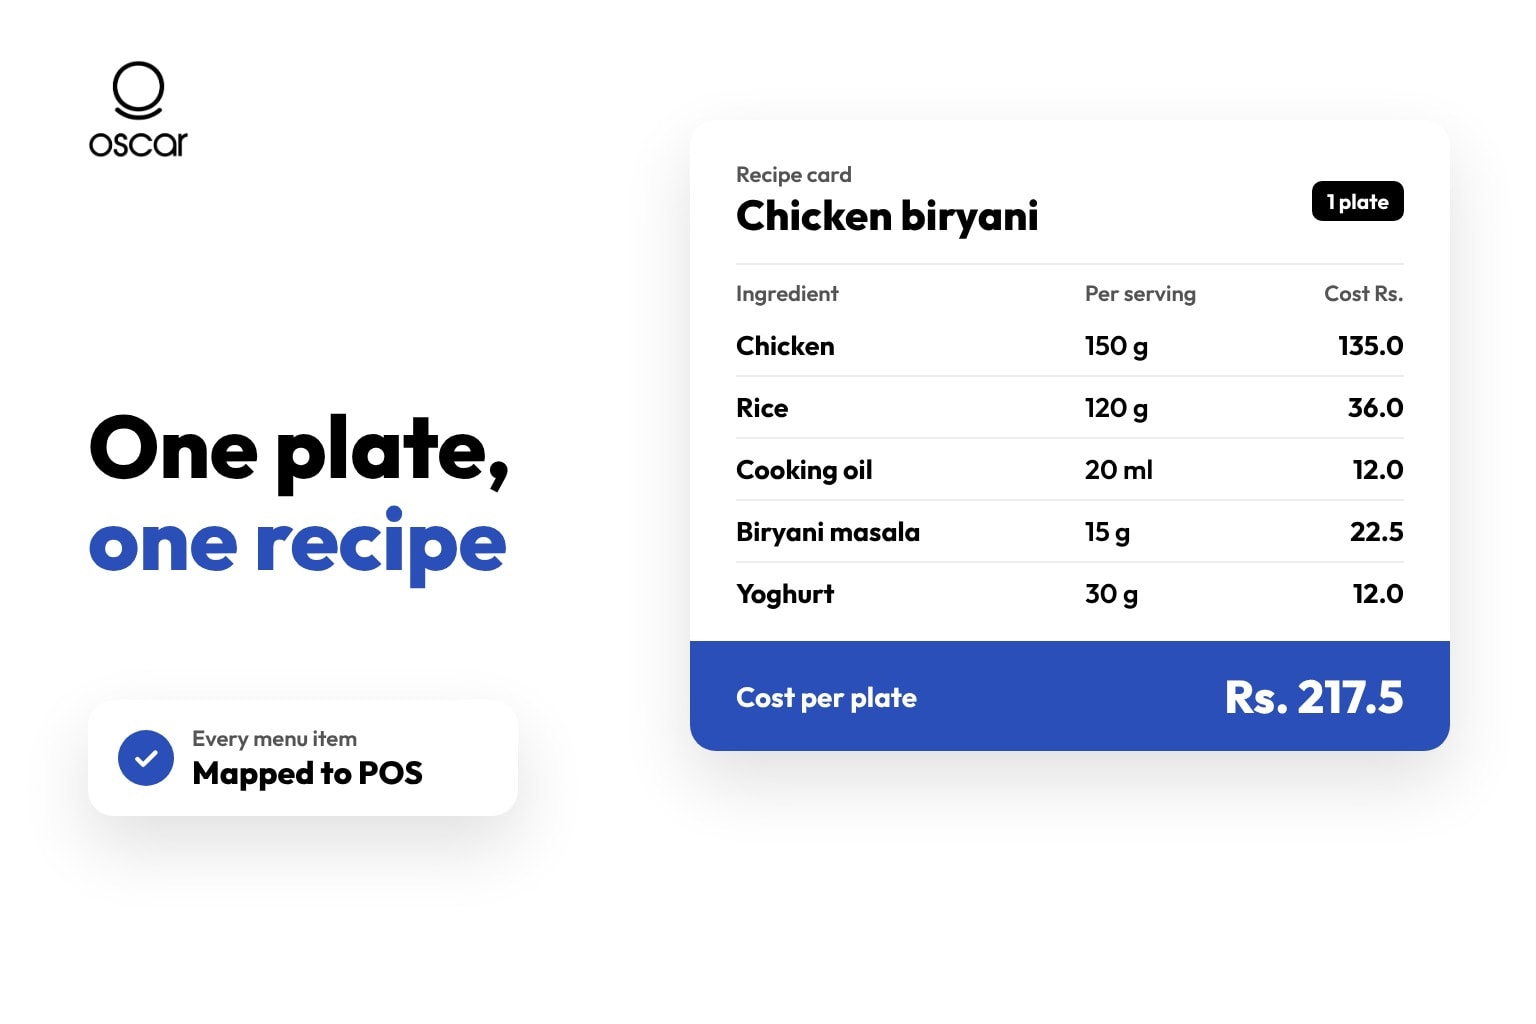
- Standardized recipes. Every menu item needs one agreed recipe listing each ingredient, the quantity per serving, the standard portion size, the preparation yield where relevant, and the cost per serving. When different chefs cook the same dish with different quantities, expected usage becomes a guess. Here is a hypothetical recipe card for one plate of chicken biryani:
The quantities and prices are illustrative, not industry averages.
- Realistic yields. Raw ingredients lose weight when trimmed, peeled or cooked. If a recipe is costed at the as-purchased price instead of the edible-portion cost, theoretical usage is understated, and a variance appears that no staff member caused.
- Sales mapped to recipes. Your POS records how many portions of each item were sold. Each menu item, including variants and modifiers such as extra chicken, must be linked to its recipe so sales can be converted into ingredient quantities. An unmapped item or modifier creates usage that no sale explains.
- Reliable stock records. Actual usage depends on accurate opening and closing counts, recorded deliveries, and documented transfers, returns and waste. Count high-value ingredients more often than low-value ones, and count at a consistent time each period so the timing of purchases and sales lines up.
Actual vs Theoretical Food Consumption
Theoretical consumption is the quantity of an ingredient your recipes say you should have used for the portions you sold. Actual consumption is the quantity your stock records show you did use over the same period. The gap between them is your variance.
Take chicken over one week. Your POS shows 100 chicken biryanis sold, and the recipe uses 150 g each, so theoretical usage is 15 kg. Your records show 40 kg in opening stock, 30 kg delivered and 52 kg counted at close, so actual usage is 18 kg. The kitchen used 3 kg more than the recipe and sales explain.
Three points make this comparison useful rather than misleading:
- Theoretical usage is an ideal, not a target you will hit exactly. It assumes perfect portions and no waste, so some positive variance is normal. The goal is to understand it and reduce it, not to force it to zero.
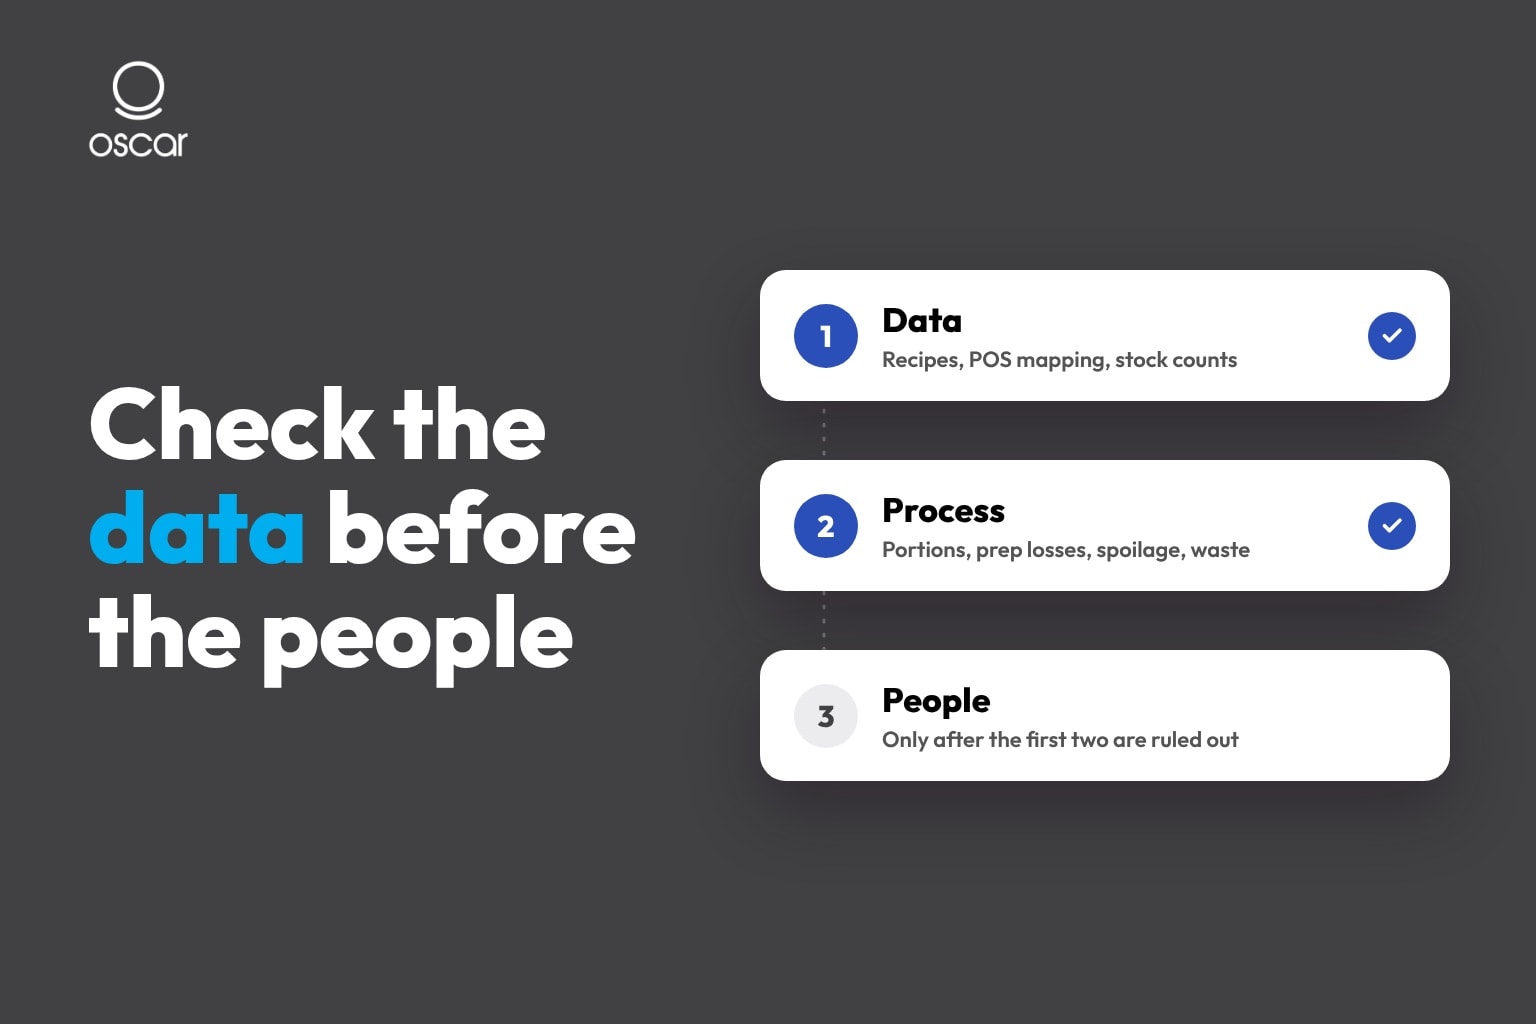
- A variance can come from the data, not the kitchen. Outdated recipes, missed counts, purchases booked in a different period from the sales they supported, and unmapped POS items all distort the result. Check the data before concluding about people.
- Quantity and cost tell different stories. The 3 kg is a quantity variance. The rupee impact is a cost variance. The next section separates the two.
How to Calculate Restaurant Consumption Variance
Use these formulas in two groups: ingredient quantity first, then financial food cost. Keep them separate.
The simplified actual-consumption formula is a starting point, not a complete one. Depending on how your restaurant records them, transfers between branches, returns to suppliers, and other adjustments must be included, or the result will be wrong. Recorded waste stays inside actual usage, but it is worth listing separately because it explains part of the variance.
Worked example: ingredient quantity variance
All figures below are hypothetical.
- Theoretical chicken consumption: 100 portions × 150 g = 15,000 g, or 15 kg.
- Actual chicken consumption: 40 kg + 30 kg - 52 kg = 18 kg.
- Consumption variance: 18 kg - 15 kg = 3 kg.
- Consumption variance %: (3 ÷ 15) × 100 = 20%.
A positive variance means actual usage exceeded expected usage. A negative variance means usage was below expectation. That is not automatically good news, because it can point to short portions, a recipe quantity that is too high, or inaccurate counts.
Now add adjustments. Suppose 1 kg of chicken was sent to another branch and the transfer was never recorded, and 0.5 kg of spoiled chicken was logged as waste. Of the 3 kg gap, 1.5 kg is now explained, which leaves 1.5 kg, or 10% of theoretical usage, to investigate.
Worked example: financial food cost variance
Again, hypothetical numbers: food sales of PKR 2,000,000. Recipe costs of the items sold total PKR 600,000, so theoretical food cost is 30%. Actual food COGS is PKR 680,000, so actual food cost is 34%. The food cost variance is 4 percentage points, which equals PKR 80,000.
Why the two variances are not interchangeable
Quantity variance counts kilograms. Cost variance counts rupees. They can move independently. If your chicken supplier raises its price and your recipe costs are not updated, your food cost variance widens even though the kitchen used exactly the right quantity. In the other direction, a kitchen can over-portion while a price fall hides the cost impact. Track both, and use quantity variance to find operational causes and cost variance to size the financial effect.
Published guidance on what counts as an acceptable variance varies, and the ranges in popular guides carry no stated methodology. One vendor guide calls under 1% excellent; another says 2% to 3% is acceptable. Treat these as examples of how widely views differ. Set your own baseline from your concept, menu mix and accounting method, then investigate unusual changes and repeated gaps.
What Causes Excessive Ingredient Consumption in Restaurants?
A positive variance has many possible causes, and most are not misconduct. Work through them roughly in this order: check the data first, then the process, then the people.
Data and record problems
- Incorrect recipe costing and quantities. Recipes that no longer match what the kitchen cooks, or that carry old ingredient prices, produce a wrong theoretical figure. The variance then reflects the recipe, not the kitchen.
- POS mapping errors. If a menu item, combo or modifier is not linked to the right recipe, sales do not deduct the right ingredients. Usage appears with no sale to explain it.
- Incorrect stock counts. Rushed counts, wrong units and missed storage areas make opening or closing stock inaccurate, and that error flows straight into actual usage.
- Unrecorded transfers. Ingredients moved between branches, kitchens or storage areas without a record look like consumption at one location and a surplus at another.
- Supplier and receiving discrepancies. If the quantity received differs from the quantity recorded or invoiced, purchases are overstated and usage looks higher than it was.
Kitchen and operational causes
- Overportioning. Staff serve more than the standard portion. A small excess per plate multiplies across hundreds of covers, and it is among the most common causes of positive variance.
- Inconsistent recipes. Different chefs prepare the same dish with different quantities, so no single standard exists to compare against.
- Food preparation losses. Trimming, peeling, bone removal and cooking shrinkage consume raw weight that a recipe may not account for.
- Spoilage. Ingredients expire or become unusable because of poor storage, weak rotation or over-ordering.
- Unrecorded wastage. Spills, burnt batches, returned dishes and discarded prep never reach the records, so they appear as unexplained usage.
Purchasing and control causes
- Inaccurate purchasing forecasts. Buying more than you can reasonably use raises spoilage risk and inflates closing stock, which can mask other problems until stock is written off.
- Theft or unauthorized usage. Ingredients can leave stock without a record. This is a real possibility, but it should be the conclusion after the causes above are ruled out, never the assumption. Accusing staff of a gap that came from a bad recipe or a mis-mapped menu item damages trust and fixes nothing.
How to Improve Consumption Management in Restaurants
The following practices attack the causes above. Start with the first two, because every later step depends on them.
1. Build a trustworthy baseline. Standardize a recipe for every menu item, with quantities and preparation yields kept current. Connect each menu item and recipe to POS sales so sales convert to ingredient usage. Without this, theoretical consumption is unreliable and nothing else works.
2. Control what leaves the kitchen. Define standard portion sizes and train the kitchen team on them, using scoops, scales and portion tools where practical. Train teams on preparation methods too, since trimming and cooking losses are part of consumption. Consistent portions shrink the variance at its most common source.
3. Keep stock records honest. Record purchases and received quantities against invoices. Count stock on a regular schedule, and reconcile physical stock with recorded stock. Log waste, spoilage, returns and transfers with a reason for each. Accurate inputs turn a variance report from a source of arguments into a source of answers.
4. Review variance by ingredient, not just in total. Monitor ingredient-level variance and look first at high-consumption and high-cost items, where small percentage gaps carry the largest cost. Investigate repeated variances for the same ingredient rather than reacting to a one-off spike, and make one person responsible for each follow-up.
5. Link consumption to purchasing and pricing. Review supplier price changes and update recipe costs so theoretical cost stays current. Use historical sales to plan purchases, which cuts both stock-outs and spoilage. Review menu items with unusually high food cost, and check whether the cause is the recipe, the portion or the price before changing the menu.
Key Metrics for Monitoring Restaurant Consumption
These twelve measures describe different things. Use them together, and do not treat one as a stand-in for another.
There is no universal ideal food cost percentage, nor a universal acceptable variance threshold. Both depend on your concept, menu mix, ingredient prices, location and accounting method. Establish your own baseline over several periods, then focus on unusual changes and recurring variances.
How Restaurant Management Software Simplifies Consumption Tracking
Doing this on paper or in spreadsheets is possible for a single outlet with a short menu. The workload grows quickly with menu size, branch count and delivery channels, because every sale has to be converted into ingredient quantities and compared with stock movement. Integrated restaurant management software can take over most of that arithmetic.
In general, a system that links the POS, recipes and stock records can:
- Store standardized recipes with ingredient quantities and cost per serving.
- Deduct ingredients automatically as menu items are sold.
- Record purchases, stock counts, transfers and waste in one place.
- Report theoretical against actual ingredient usage, so variances surface without manual calculation.
- Alert managers when stock is running low.
- Show stock and sales across several branches in one view.
Software does not fix bad inputs. If recipes are outdated, POS items are unmapped or counts are careless, the system will calculate wrong numbers faster. The sequence still matters: standardize recipes, map the menu, then automate.
Managing Restaurant Ingredient Consumption with Oscar
Oscar is a cloud-based POS and restaurant management platform built for restaurants in Pakistan. Based on the descriptions on its own restaurant pages, here is how its capabilities line up with the consumption cycle described above:
The practical value is visibility. Instead of waiting for a monthly stocktake to learn that chicken usage ran high, a manager can see sales and ingredient usage side by side while there is still time to act.
If you want to see how this would work for your own menu, ask for a demo and bring a few real recipes with you.
Frequently Asked Questions About Restaurant Consumption Management
1. What is consumption management in a restaurant?
It is the process of calculating how much of each ingredient should have been used based on the dishes sold, measuring how much was actually used, and investigating the difference. It connects recipes, POS sales and stock records so restaurants can control ingredient costs.
2. What is the difference between inventory management and consumption management?
Inventory management answers "how much stock do we have?". Consumption management answers "how much should we have used, how much did we use, and why do they differ?". Inventory data feeds consumption analysis, but the two have different goals.
3. What is the difference between actual and theoretical food consumption?
Theoretical consumption is the quantity your recipes say you should have used for the portions sold. Actual consumption is what your stock records show was used, calculated from opening stock, purchases, closing stock and adjustments. Subtract one from the other to get the variance.
4. How do restaurants calculate ingredient consumption and variance?
Multiply the recipe quantity per serving by the number of portions sold to get the theoretical consumption. For actual consumption, take opening stock plus purchases minus closing stock, adjusted for transfers and returns. Variance is actual minus theoretical, and variance percentage divides that by theoretical consumption.
5. What causes excessive ingredient consumption?
Common causes include overportioning, inconsistent recipes, preparation losses, spoilage, unrecorded wastage, miscounted stock, supplier discrepancies, POS mapping errors, unrecorded transfers and poor purchasing forecasts. Theft is possible but should be considered only after data and process errors are ruled out.
6. How can restaurants reduce food waste and ingredient losses?
Standardize recipes and portions, train kitchen staff, record all waste with a reason, count stock regularly, and review ingredient-level variance each week. Purchasing from historical sales rather than habit also reduces spoilage.
7. Can POS software track ingredient consumption?
Yes, if the POS is linked to recipes and stock records. The system converts each sale into ingredient quantities and deducts them from stock, so usage can be reviewed without manual calculation. Oscar's restaurant pages describe recipe and inventory management and consumption tracking behind every order.
8. How does Oscar help restaurants manage ingredient consumption?
According to its restaurant pages, Oscar combines recipe management, wastage tracking, stock alerts and reporting, and lets managers compare sales with actual ingredient usage, including across multiple branches. A demo is the best way to confirm how this fits your menu and workflow.
Conclusion
Restaurant consumption management turns a vague worry about rising food costs into a specific question with an answer: how much of this ingredient did our sales justify, and how much did we use? Standardized recipes, mapped POS sales, and honest stock records give you the expected and actual figures. The gap between them tells you where to look, and checking the data before the people keeps the investigation fair.
Start small. Pick your five highest-cost ingredients, standardize their recipes, compare expected and actual usage for one week, and investigate the largest gap. If you would rather have this running automatically across your menu and branches,book a free Oscar demo and see ingredient usage next to your sales.